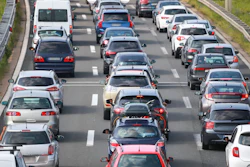
Results from a new study show major metropolitan areas -- especially near their airports -- are some of the riskiest places to drive in the U.S. It also found the times of day and night when collisions are expected to occur.
Lytx Inc., a leader in video safety and video telematics, recently released its fifth annual “State of the Data” report for trucks and vehicle fleets. Leveraging the Lytx Driver Safety Program and over 36 billion miles of new driving data (over 221 billion miles total) captured through Lytx’s DriveCam Event Recorders, 2022 showed a decrease in overall risky driving even as miles driven increased.
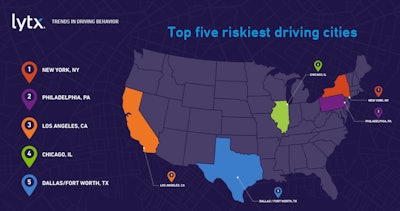
While many of 2021’s riskiest driving cities remained in the top five, Atlanta improved to number seven, while Dallas/Fort Worth entered the top five. New York remained number one for the second year in a row.
Top five riskiest driving cities:
- New York
- Philadelphia
- Los Angeles
- Chicago
- Dallas/Fort Worth
While many of 2021’s riskiest driving cities remained in the top five, Atlanta improved to number seven, while Dallas/Fort Worth entered the top five. New York remained number one for the second year in a row.
Top five riskiest public roadways include:
- Michigan (I-94 at Merriman Road, Romulus) A complex airport interchange
- New York (George Washington Bridge near Riverside Drive, NY) The world’s busiest vehicular bridge
- California (Edom Hill Road and Varner Road, Desert Hot Springs) A lack of lane markings
- New Jersey (NJ19 and I-80 in Paterson) A complex interchange, with highways terminating into city streets
- Connecticut (I-95 near Fulton Terrace, New Haven) A curved freeway entering the busy port of New Haven
Airports have emerged as some of the nation’s most dangerous driving areas. Fully14 out of 30 of the highest-risk sections of public and private roadways were within two miles of airports, in 2022. This number was up 86% from 2021, when eight of the top 30 highest-risk roadways were near airports.
The top five high-risk airports to drive around include:
- Denver International
- John Glenn Columbus International
- Phoenix Sky Harbor
- John F. Kennedy International
- Newark Liberty International
“Airports likely stand out as having among the more dangerous roadways due to several factors, including the high number of intersections and transitions, the high percentage of drivers unfamiliar with the routes, the high concentration of cars, and of course, hurried or distracted behaviors such as looking at mobile phones,” said Kyle Warlick, Senior Client Intelligence Analyst at Lytx.
The time of day also impacts the likelihood of a collision. The survey found:
- In 2022, the highest total number of collisions occurred during the daytime hours (6 a.m. to 4 p.m.), with the most occurring at 11 a.m.
- Alternatively, the highest collisions per vehicle (those on the road at each hour) occurred in the middle of the night (2 a.m. to 6 a.m.) with 2 a.m. the most likely time for a collision.
The data showed that the largest number of collisions occurred when traffic volumes are highest during the day, and per-vehicle collisions occurred most often late at night when visibility is darkest and traffic volumes were lower.


Even the day of the week impacts the likelihood of a collision. In 2022, the highest collisions per vehicle occurred on Tuesdays. Saturdays were the safest day of the week, with the lowest collisions per vehicle. Sundays were the second lowest.
Findings suggest that high weekday commute traffic very closely correlated to higher numbers of collisions and was further supported by weekend lows.
Most collisions happen in clear weather, often due to animal strikes. The survey showed:
- While 13.1% of collisions occurred during rainy weather, 83.9% occurred in clear conditions, with only 2.9% occurring in snowy weather and 0.1% in foggy conditions.
- Animal strikes accounted for 29.7% of the collisions in clear weather and 9.4% in rainy conditions. In contrast, fixed objects accounted for 11.7% of accidents in clear conditions and 16% in rainy conditions.