The torch has been passed.
New Jersey's reign as home to the worst bottleneck for freight traffic has finally come to an end.
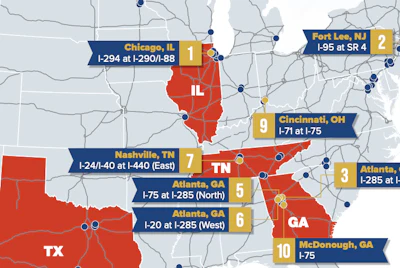
In its place is the interchange of Interstate 294 and Interstates 290/88 in Chicago.
That's one of the key findings of the American Transportation Research Institute 15th annual list highlighting the most congested bottlenecks for trucks in America. That report was released today.

The rest of the top 10 list includes:
3. Atlanta: I-285 at I-85 (North)
4. Houston: I-45 at I-69/US 59
5. Atlanta: I-75 at I-285 (North)
6. Atlanta: I-20 at I-285 (West)
7. Nashville: I-24/I-40 at I-440 (East)
8. Houston: I-10 at I-69/US 59
9. Cincinnati: I-71 at I-75
10. McDonough, GA: I-75
“Congestion delays inflicted on truckers are the equivalent of 436,000 drivers sitting idle for an entire year,” said ATRI President and COO Rebecca Brewster. “While these congestion metrics are getting worse, the good news is that states do not need to accept the status quo. Illinois has been home to the country’s top bottleneck before, but following a sustained effort to expand capacity, its previous #1 bottleneck at the Jane Byrne Interchange no longer ranks in the top 25. This data gives policymakers a road map to reduce chokepoints, lower emissions, and drive economic growth.”
The 2026 Top Truck Bottleneck List measures the level of truck-involved congestion at more than 325 locations on the national highway system. The analysis, based on an extensive database of freight truck GPS data, uses several customized software applications and analysis methods, along with terabytes of data from trucking operations to produce a congestion impact ranking for each location.
The bottleneck locations detailed in this latest ATRI list represent the top 100 congested locations, although ATRI continuously monitors more than 325 freight-critical locations.




ATRI’s analysis, which utilized data from 2025, found traffic conditions continue to deteriorate from recent years, in some instances due to work zones that result from increased infrastructure investment. Average rush hour truck speeds were 33.2 MPH, 2.8 percent slower than the previous year. Among the top 10 locations, average rush hour truck speeds were 29.6 MPH.
For access to the full report, including detailed information on each of the 100 top congested locations, visit ATRI’s website here. ATRI is also providing animations created with truck GPS data for select bottleneck locations, all available on its website.