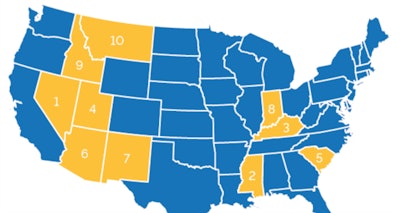
A new survey by a financial services company suggests the best states for truckers are those in the West from the Canadian border to Mexico, as well as a handful primarily in the South.
The survey by Seek Business Capital also says the worst places financially speaking for truckers are the East Coast and California.
The company based its ranking of all 50 states and Washington, D.C. on how truck driver pay compares to that of all workers in the state, and also on how trucker pay compares to a state’s cost of living.
For example, here’s how Seek Business Capital explains why Nevada is the number one place to live if you’re a truck driver:
“In many respects, Nevada is the best state in the country for truck driver pay. Only Alaska, (Washington) D.C. and North Dakota have higher mean wages, but Alaska and D.C. have much higher costs of living than Nevada, and wages for North Dakota truckers are below the average state per capita income. In contrast, Nevada truckers earn nearly 21 percent more than the average per capita income, putting it first in that category. Nevada is also one of only seven states with no state income tax.”
| The Best States for Truck Driver Salaries | ||||
| Overall Rank | State | Average Annual Truck Driver Wage | Average Per Capita Income for All Occupations (Incl. Non-Trucking Jobs) | How Much More Truck Drivers Make Than the Average Worker |
| 1 | Nevada | $50,920 | $42,185 | +20.71% |
| 2 | Mississippi | $41,900 | $35,444 | +18.21% |
| 3 | Kentucky | $45,550 | $38,989 | +16.83% |
| 4 | Utah | $45,600 | $39,045 | +16.79% |
| 5 | South Carolina | $44,270 | $38,041 | +16.37% |
| 6 | Arizona | $45,430 | $39,060 | +16.31% |
| 7 | New Mexico | $44,460 | $38,457 | +15.61% |
| 8 | Indiana | $46,210 | $40,998 | +12.71% |
| 9 | Idaho | $42,010 | $37,509 | +12.00% |
| 10 | Montana | $46,100 | $41,280 | +11.68% |
| The Worst States for Truck Driver Salaries (Plus D.C.) | ||||
| Overall Rank | State | Average Annual Truck Driver Wage | Average Per Capita Income for All Occupations (Incl. Non-Trucking Jobs) | How Much Less Truck Drivers Make Than the Average Worker |
| 51 | Washington D.C. | $52,760 | $71,496 | -26.21% |
| 50 | Connecticut | $49,880 | $66,972 | -25.52% |
| 49 | Virginia | $42,660 | $52,136 | -18.18% |
| 48 | New Jersey | $49,080 | $59,782 | -17.90% |
| 47 | New Hampshire | $45,030 | $54,817 | -17.85% |
| 46 | Massachusetts | $50,310 | $61,032 | -17.57% |
| 45 | Maryland | $47,940 | $56,127 | -14.59% |
| 44 | New York | $50,460 | $57,705 | -12.56% |
| 43 | California | $47,300 | $52,651 | -10.16% |
| 42 | Wyoming | $50,200 | $55,303 | -9.23% |
| 41 | South Dakota | $41,590 | $45,002 | -7.58% |