
Likewise, you don’t get to choose the other motorists with who you share the highway.
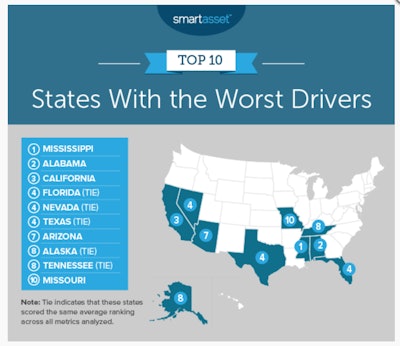
A new study by the financial services company SmartAsset found out just where some of the nation’s worst drivers are. Primarily, they’re in the South. (Scroll down to see how all 50 states ranked.)
It ranked drivers in all 50 states and found the top 10 states for bad drivers include:
Mississippi
Alabama
California
Florida
Nevada
Texas
Arizona
Alaska
Tennessee
Missouri
SmartAsset explains how it arrived at the ranking:
“In order to find the states with the worst drivers, we looked at data on all 50 states. Specifically, we looked at data on the following four metrics:
- “Fatalities per 100 million vehicle miles driven. Data comes from the National Highway Traffic Safety Administration and is from 2016.
- “Arrests for driving under the influence per 1,000 drivers. Data on DUI arrests come from the FBI. Data on the number of drivers come from the Department of Transportation. Data is from 2017.
- “Percentage of drivers who are insured. Data comes from the Insurance Research Council and is from 2017.
- “Google Trends on driving tickets. This is how often residents in each state google “speeding ticket” and “traffic ticket.” To control for the number of drivers in each state, we compared “speeding ticket” and “traffic ticket” Google Trends data to “gasoline” Google Trends data. We pulled data for the period between May 2018 and May 2019.
“First, we ranked each state in each of the four metrics. Then we found each state’s average ranking, giving each metric equal weighting. We used the average rankings to create our final score. The state with the best average ranking received a score of 100, while the state with the worst average ranking received a score of 0.”
Here’s the whole list:


