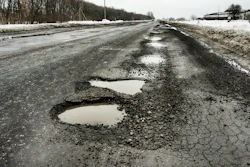
Many of the bridges you drive over each day are in bad shape.
In fact, a new report from a national trade organization says 47,052 of America’s 616,087 bridges are what it calls “structurally deficient” and in poor condition. The association estimates the cost to make needed repairs is about $171 billion.
In addition, the pace for making repairs to those bridges has slowed. At the current rate, it would take 80 years to fix all of the nation’s structurally deficient bridges, according to the report.

The ARTBA’s report released Monday, April 1 also says vehicles, including tractor-trailers, cross compromised structures 178 million times every day. The most traveled structurally deficient bridges are on parts of Route 101, Interstate 405 and Interstate 5 in California, where daily crossings are as high as 289,000 per day.
“Sadly, this report is no April Fool’s joke. At the current pace, it would take more than 80 years to replace or repair the nation’s structurally deficient bridges. That’s longer than the average life expectancy of a person living in the U.S.,” says Dr. Alison Premo Black, the ARTBA chief economist who conducted the analysis. “America’s bridge network is outdated, underfunded and in urgent need of modernization. State and local government just haven’t been given the necessary resources to get the job done.”
Here are the 10 jurisdictions with the highest percentage of structurally deficient bridges:
- Rhode Island, 23.1 percent
- West Virginia, 19.9 percent
- Iowa, 19.4 percent
- South Dakota, 16.7 percent
- Pennsylvania, 16.6 percent
- Maine, 13.1 percent
- Louisiana, 13 percent
- Puerto Rico, 11.7 percent
- Oklahoma, 11 percent
- North Dakota, 10.8 percent
See a state-by-state analysis of the number and condition of bridges.


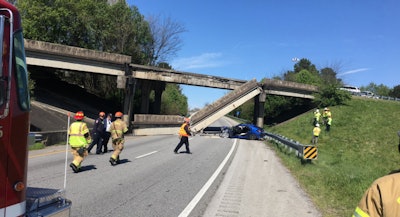
As, if you needed more convincing, there are these Facebook posts from the Tennessee Highway Patrol today.