It's a good bet that some of the bridges you drive over on a daily basis are structurally deficient, and many may even need to be replaced.
Those are two of the findings of a recent review of a federal agency's assessment of the nation's bridges.
In all, more than 222,000 U.S. bridges need major repairs or should be replaced, according to the American Road & Transportation Builders Association’s analysis of the recently released U.S. Department of Transportation 2023 National Bridge Inventory database. That figure represents 36 percent of all U.S. structures.
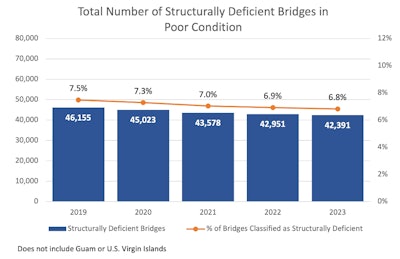
The analysis also found that 76.600 bridges are in need of replacement and that 42,400 are considered to be in poor condition. Still, Americans drive across those bridges 167 million times a day. However, the association's review also found the number of bridges in poor condition declined by 560 compared to 2022.
Additionally, over the last five years, the share of bridges in fair condition continues to grow. In 2023, nearly half of all U.S. bridges (48.9 percent) were considered to be in fair condition.
If placed end-to-end, bridges in need of repair would stretch over 6,100 miles and take over 110 hours to cross at an average speed of 55 miles per hour, according to ARTBA Chief Economist Dr. Alison Premo Black, who conducted the analysis. Based on average cost data submitted by states to U.S. DOT, Black calculates it would cost over $319 billion to make all needed repairs.
The ranking of states with the most structurally deficient bridges as a percentage of their total number of bridges includes:
- West Virginia (1,442, 20%)
- Iowa (4,558, 19%)
- South Dakota (985, 17%)
- Rhode Island (120, 15%)
- Maine (372, 15%)
- Pennsylvania (3,022, 13%)
- Puerto Rico (294, 13%)
- Louisiana (1,545 12%)
- Michigan (1,292, 11% )
- North Dakota (455, 11%)
The government classifies a bridge as “structurally deficient” if any one of the following bridge components are rated less than or equal to 4 (in poor or worse condition):
- Deck condition
- Superstructure condition
- Substructure condition
- Culvert condition
The FHWA uses four factors in determining the “sufficiency rating” of a bridge, which is its sufficiency to remain in service. Each bridge is assigned a numerical percentage rating between zero and 100, with 100 being the ideal.
States currently have access to $10.6 billion from the 2021 federal Infrastructure Investment and Jobs Act’s bridge formula funds that could help make needed repairs, with another $15.9 billion to be available in the next three years.
As the end of FY 2023 approaches on Sept. 30, states have committed $3.2 billion, or 30 percent of available bridge formula funds to 2,060 different bridge projects, with $7.4 billion still coming.
The full findings, including state-by-state rankings, are available at: www.artbabridgereport.org.


